Crypto Risk Calibration
Cryptocurrency first manifested into existence in 2008, when the first ever Bitcoin was mined. It has since grown, with thousands of variants now available to purchase by the armchair investor. Some financial institutions have also gotten in on the game, although the level of trading pales compared to other major asset classes.
By applying principles used by insurance companies in asset risk calibration, I have constructed a risk calibration for cryptocurrency risk. I am not aware of any insurers who would need such a calibration, but if they did, they might take inspiration from this article.
Disclaimer: This article is NOT an endorsement of cryptocurrency as an asset class.
The Premise
An insurance company has a non-trivial holding in the cryptocurrency markets. An internal model calibration for this risk exposure is required. By applying some of the principles used for other major asset classes, such as property and equity, I consider what that risk calibration might look like.
It is also expected that the insurance company would have a significant holding in UK equity markets, and that the insurer has a risk scenario generator. These assumptions are necessary when considering how our cryptocurrency risk might contribute to the final SCR of a company.
Data
Empirical Data
Index data was taken from a publicly available source: https://www.investing.com/. We have selected the data for value in GBP of the four of the largest cryptocurrencies by market capitalisation: Bitcoin (BTC), Ethereum (ETH), Ripple (XRP), and Dogecoin (DGE).
We have used data as far back as available, capped to 2012. This represents different start dates for different cryptocurrencies. We have:
Jan-12 for BTC (Bitcoin)
Feb-15 for XRP (Ripple)
Apr-16 for ETH (Ethereum)
Jul-17 for DGE (Dogecoin)
The data used is up until May-25, which was the latest available month at time of writing.
We performed an array of stationarity tests on the Bitcoin dataset. In all cases p-values were above 0.05, meaning we could not reject any of the null hypotheses. This was both in tests where the null hypothesis was the data contains a trend, and when the null hypothesis was the data is level.
The index data looks as follows:
Transformation(s)
Index data is transformed to monthly annual overlapping investment returns. The benefit of this is the generation of extra data points. Given the limited history of cryptocurrency, this was an essential transformation. The downside to this approach would be any autocorrelation within our datasets.
We are completing our analysis on the excess-of-mean returns. To do this, we deducted the historical mean from our datasets, such that the mean of the simple returns is 0%. It should be noted that this was not a trivial amount for cryptocurrency.
In this analysis we have chosen to use log returns. This has the advantage of allowing returns to occupy a range between ±∞, unlike simple returns which can theoretically be below -100%. This is particularly useful for the incredibly volatile asset that is crypto-currency, where distribution fitting would likely extend beyond the -100% for non-trivial probabilities.
We then added in a risk premium to reflect the best estimate of expected returns for this asset class. When choosing a value it is worth considering what type of asset cryptocurrency is. If it is indeed a currency, then a risk premium of 0% would seem appropriate given currency is not a growth asset. However cryptocurrency appears to act more like a commodity that investors purchase in the hope that someone will pay more for it in the future. This is more akin to a bar of gold than a dollar.
Given the asset acts more like a commodity, we are assuming the expected return to be similar to expected inflation. At time of writing (May 2025) the inflation rate is high, however the Office for Budget Responsibility (OBR) has predicted from 2026 rates will be around 2%, with a range of around 0-5%. We have therefore set our risk premium to be 3%, closer to the current rate of inflation. [https://obr.uk/efo/economic-and-fiscal-outlook-march-2025]
It should be noted that when we combined these transformations, the mean of our datasets was very negative. For example the mean of log transformed BTC data, before adding any risk premium adjustments, was -81%. This is due to the extreme volatility found in cryptocurrency, as well as the large returns in general.
Annualised Change
We present the empirical data for our 4 chosen cryptocurrencies in the plots below. Firstly we show the time series of the annual log returns, as well as histograms of their distributions.
Perhaps the most striking things from the data are:
The annualised log changes are enormous. For comparison a similar distribution for UK Equities would be very rare to see a point beyond the ±50% range.
The 4 different cryptocurrencies are highly correlated in their movements. They almost move in complete synchronicity.
The distributions have quite negative means. This is a consequence of our log transformations. This amount can often be trivial for standard assets, however as the variance of cryptocurrency returns is huge, the mean of log returns is a lot lower than 0%.
Distribution Fitting
We tried to fit a range of distributions to each one of our data sets. The distributions attempted (with the number of parameters in parentheses) are:
Normal (2)
Logistic (2)
Student T (3)
Hyperbolic (4)
We show the QQ plots for these fitting attempts below. We decided not to show the Student T as it typically converged to the Normal distribution and did not offer much alternative in terms of distribution choice.
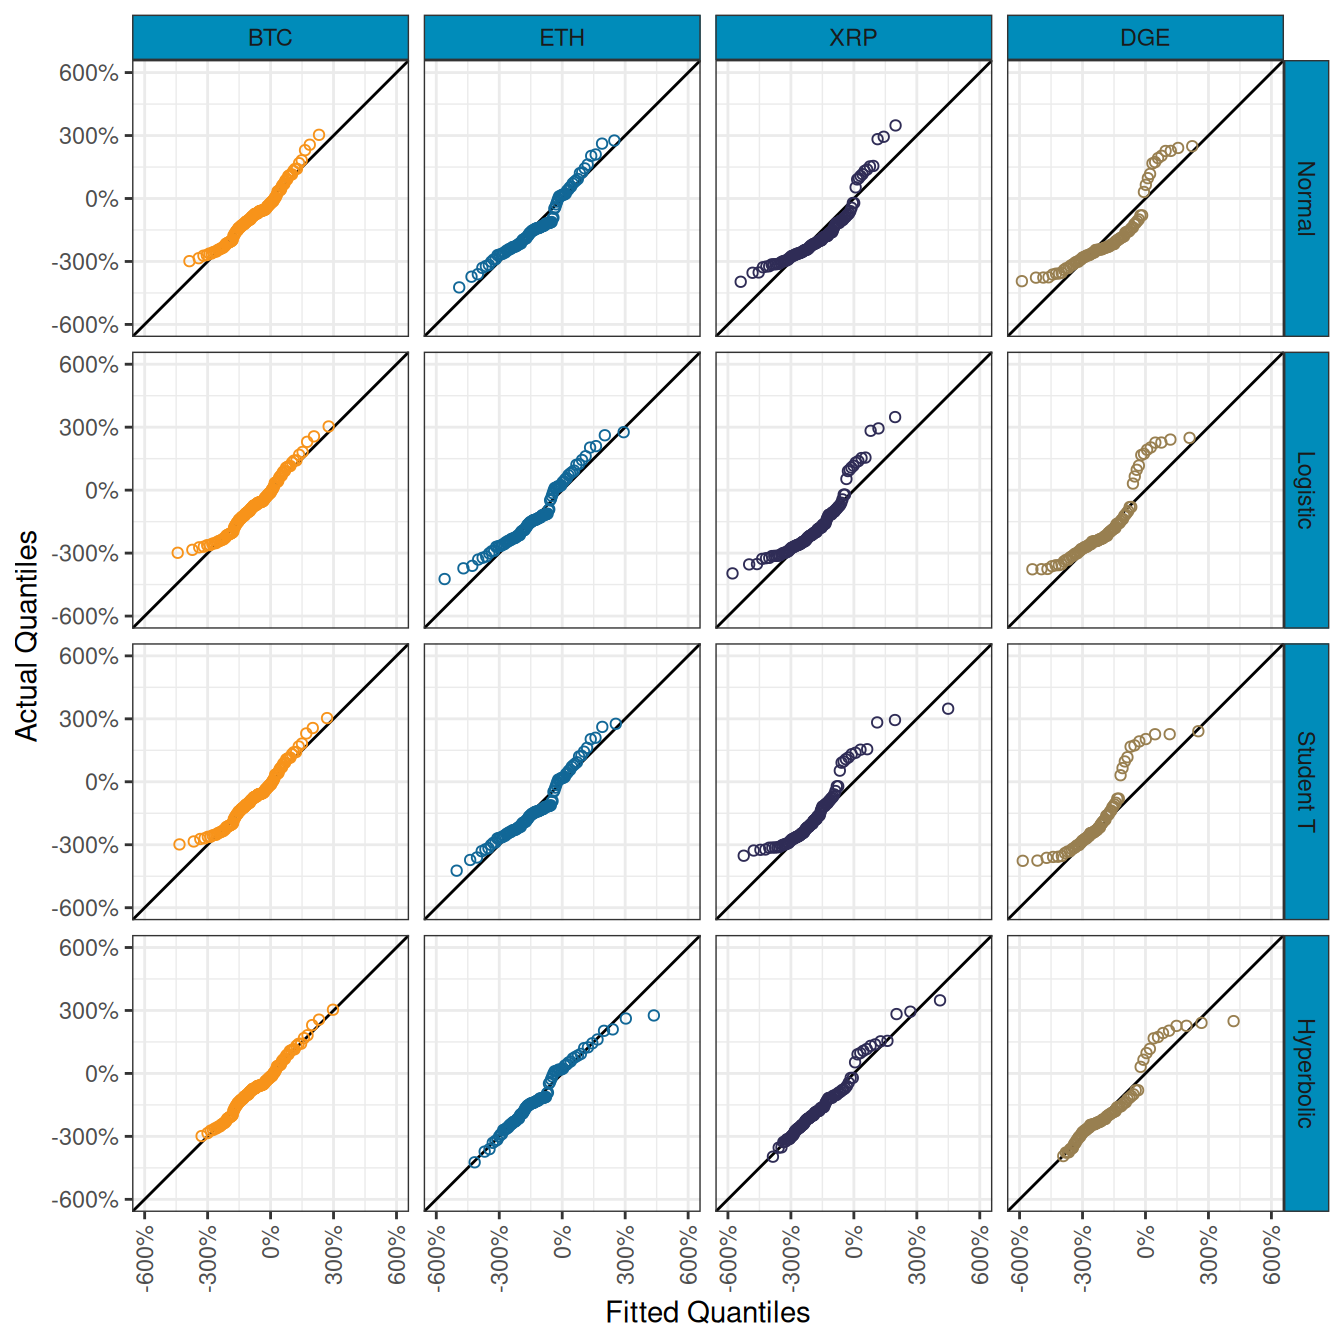
From the QQ plot we can infer:
For BTC, ETH and XRP it seems like the Hyperbolic distribution fits the best. This is particularly true around the negative tail, which is the most important part of the distribution for our purposes.
For DGE the Hyperbolic also seems to fit better around the negative tail. It should be noted that the unusual history of Dogecoin was hard to fit any distribution to. This is perhaps not surprising for an asset that is influenced more by Elon Musk tweets than any other market force.
The Normal, Student T and Logistic distributions struggled around the tail. This is perhaps not surprising given all 3 are symmetrical distributions, and the actual historical returns are highly skewed.
Also helpful in determining the best fit are fitting statistics. We have calculated the following values:
Residual Sum of Squares (RSS) - this is the sum of least square values from our QQ plots. The lower the value, the better the fit.
Maximum Likelihood Estimator (MLE) - this is the likelihood of our empirical points upon our fitted distribution. The higher the value, the better the fit.
Akaike Information Criterion (AIC) - this is a fitting statistic based on the MLE. The lower the value, the better the fit.
Bayes Information Criterion (BIC) - similar to AIC, this statistic also penalises higher distributions with more parameters. The lower the value, the better the fit.
We present these in the tables below. To make deciphering easier, we have applied a colour scale over the table with redder values being poorer and whiter values being better fitting statistics:
| Distribution | RSS | LogLik | AIC | BIC |
|---|---|---|---|---|
| Normal | 2.371 | −230.8 | 465.6 | 471.6 |
| Logistic | 2.531 | −229.7 | 463.3 | 469.3 |
| Student T | 2.481 | −229.8 | 465.7 | 474.7 |
| Hyperbolic | 1.451 | −226.9 | 461.8 | 473.8 |
| Distribution | RSS | LogLik | AIC | BIC |
|---|---|---|---|---|
| Normal | 3.014 | −174.7 | 353.4 | 358.6 |
| Logistic | 3.425 | −174.9 | 353.8 | 358.9 |
| Student T | 3.026 | −174.7 | 355.3 | 363.1 |
| Hyperbolic | 2.281 | −169.6 | 347.3 | 357.6 |
| Distribution | RSS | LogLik | AIC | BIC |
|---|---|---|---|---|
| Normal | 5.674 | −197.5 | 399.0 | 404.4 |
| Logistic | 5.865 | −190.5 | 384.9 | 390.4 |
| Student T | 7.888 | −185.9 | 377.7 | 385.9 |
| Hyperbolic | 2.073 | −173.7 | 355.3 | 366.2 |
| Distribution | RSS | LogLik | AIC | BIC |
|---|---|---|---|---|
| Normal | 6.151 | −157.6 | 319.2 | 324.1 |
| Logistic | 6.558 | −153.5 | 310.9 | 315.8 |
| Student T | 12.299 | −146.9 | 299.8 | 307.1 |
| Hyperbolic | 3.826 | −138.7 | 285.5 | 295.1 |
It is clear for all 4 crypto assets, the Hyperbolic distribution has the better fitting statistics. This is true across the RSS, LogLik, AIC and BIC. The only occasion where Hyperbolic does not give the best result is for the BIC for Bitcoin. The BIC applies larger penalties for higher numbers of parameters, and as Hyperbolic has the most (at 4 parameters), it seems this is enough penalty to demote the Hyperbolic distribution. Despite this, it is quite clear Hyperbolic is preferable for every crypto asset analysed.
Final Distributions
Our final chosen fitted distributions are:
BTC - Hyperbolic
ETH - Hyperbolic
XRP - Hyperbolic
DGE - Hyperbolic
Below we show the key percentiles for change in asset value over a one year time horizon. To make the results easier to interpret, we have converted the annualised log returns back into annualised simple returns.
| Percentile | BTC | ETH | XRP | DGE |
|---|---|---|---|---|
| 99.5% | +1,442.3% | +7,974.4% | +5,147.9% | +8,516.5% |
| 97.5% | +457.9% | +1,036.9% | +560.1% | +815.4% |
| 90.0% | +104.7% | +103.4% | +9.7% | +27.6% |
| 50.0% | −58.5% | −76.9% | −87.1% | −89.1% |
| 10.0% | −88.4% | −93.9% | −95.2% | −96.7% |
| 2.5% | −93.4% | −96.9% | −96.7% | −97.6% |
| 0.5% | −95.9% | −98.5% | −97.8% | −98.0% |
It is quite clear that a 1-in-200 event would essentially wipe out all cryptocurrency value. In fact, even a 1-in-10 event would cause significant damage to asset values.
Even the median of these distributions is very negative, with a 1-in-2 event seeing Bitcoin values almost half over the year. The reason we observe this is a consequence of using log transformed returns to fit our distributions to. This was explained at the end of the ‘Data Transformation’ section.
Specific Risk
Another consideration to make would be to have an overlay for this risk distribution. This would be with the aim of recognizing that we have fitted our distribution to a fairly short time period of of around 8-13 years, which could mean there are no extreme tail events within the dataset.
The risks to any single currency are not insignificant. https://www.hedgewithcrypto.com/ notes that there have been between 1,700 and 2,500 cryptocurrencies to collapse into zero value. The largest being ‘Luna’ which had been a top 10 crypto by market capitalisation before collapsing to zero.
This information may be a reason to apply an overlay to our current distributions. We have not explored this any further here. This specific risk could potentially be diversified away through investment in many different crypto assets.
Correlations
We consider the correlations of market movements between cryptocurrencies, as well as against other asset classes. By calculating Spearman’s rank correlation, we construct a correlation matrix, which is visualised below:
Crypto Intra-dependencies
By diversifying our portfolio we might remove specific risks (i.e. the risk of an individual crypto collapsing, like Luna). However systemic risk may still exist across all cryptocurrencies.
Cryptocurrencies are very highly correlated in their market movements. There is barely any systemic diversification benefit between the currencies. Given the very high correlation already in our historical data, we would suggest using the same risk driver to model all cryptocurrency risk in a portfolio would likely be sufficient.
Crypto Inter-dependencies
How does cryptocurrency correlate with other asset classes? Bitcoin is sometimes described as “Digital Gold” [https://www.db.com/what-next/digital-disruption/dossier-payments/i-could-potentially-see-bitcoin-to-become-the-21st-century-gold]. Earlier we likened the two assets when trying to assign a risk premium for our crypto coins. Gold is a commodity. It is also negatively correlated to market trends in major asset classes such as equities. When the market takes a downturn, gold can often rise as investors see it to be a safe haven. As such gold can provide utility as a partial hedge within an investment portfolio.
Based on the correlations of cryptocurrency against Gold Futures and FTSE 100, we draw the following conclusions:
Gold is (weakly) negatively correlated to the UK Equity market, as shown by the correlation of -0.15. It could be considered as a good asset for diversification in an equity rich portfolio.
Cryptocurrency acts nothing like Gold. The correlation is close to zero for all cryptocurrencies tested.
Cryptocurrency is positively correlated to the FTSE 100, and not by a neglible amount. BTC scores a correlation on +0.50 against the FTSE 100. It appears to offer little in the way of hedging to the UK Equity market. If we take the price of gold to reflect (lack of) confidence in the market, it seems Bitcoin does not copy this reflection at all.
With material positive correlation to UK Equity market, and the extreme distributions we have fitted to cryptocurrency data, it is likely most insurance companies would observe an obliteration of crypto values within their biting scenario (if they held crypto).
Conclusion
The following conclusions can be made:
Cryptocurrencies are incredibly volatile.
Applying our techniques lead to a distribution where only a 1-in-10 event would see almost all asset value wiped out. Even a median event will see asset values decline sharply.
Cryptocurrencies are highly correlated between each other in market movements. There is no doubt modeling all crypto assets with the same risk driver would be sufficient.
Crypto assets are positively correlated with the UK equity market. Given equity risk is often a significant risk for a major insurer, we expect many SCR biting scenarios to be at the negative end of the distribution for equities. Given this correlation, the crypto biting scenario will also likely be at the negative end of the distribution.
Given all these points above, we would expect the overall biting scenario for a major insurer to see cryptocurrency value completely decimated. The conclusion reached is that almost all assets held as cryptocurrency will increase the SCR of a company by a similar amount. This conclusion might lead an actuary to question how capital efficient it is to invest in crypto.
The code used to generate the results in this article can be found at: https://github.com/paulbeardactuarial/crypto_calibration
This article was written by Paul Beard and published on 30th May 2025